Functional Analysis
A main component of metagenomic analysis is to figure out what the organisms in your sample are actually doing. There are many ways to do this, but one common and straightforward approach is to query a specific set of known sequences that have an associated function, or can be related to a series of functions. Examples of different approaches are:
- Gene Prediction: This almost always requires an assembled sequence, which metagenomic datasets do not guarantee, though for novel genes/organisms this is often a must. MGRAST is a popular tool, but there are many others.
- Marker Gene Associated Functional Inference: Very useful for targeted metagenomics. Can extrapolate function if an associated gene is present. PiCRUST is a good (and locally sourced) software package for this.
- Marker Gene Analysis: The quickest/most straightforward approach - search your reads against a database of known genes with known function. HUMAnN2 is a good software package to use, though MEGAN6 is also popular.
Overview
- Obtain/compile functional database
- Query reads against database
- Assign function to your sample
HUMAnN2
HUMAnN is a pipeline for efficiently and accurately profiling the presence/absence and abundance of microbial pathways in a community from metagenomic or metatranscriptomic sequencing data (typically millions of short DNA/RNA reads). This process, referred to as functional profiling, aims to describe the metabolic potential of a microbial community and its members. More generally, functional profiling answers the question "What are the microbes in my community-of-interest doing (or capable of doing)?"
The workflow essentially involves cleaning your data, identifying potential genes within a database, and compiling genes into pathways and gene families. The workflow can be seen below:
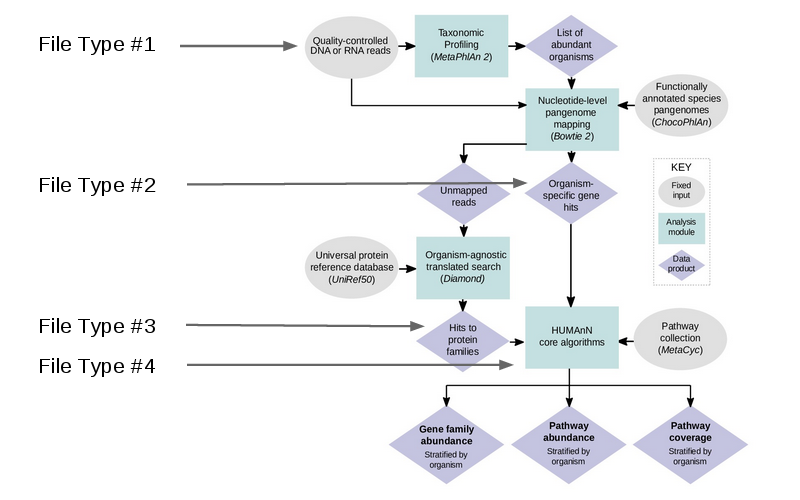
HUMAnN2 is capable of accepting multiple filetypes at different stages of analysis, making this very flexible tool to integrate into custom pipelines. For this example, we will use the cleaned reads (the output from KneadData).
ChocoPhlAn Datbase
Much like the Kraken data we used in the previous section, ChocoPhlAn is a proprietary database used with HUMAnN2. It was created by clustering the NCBI coding sequence. Since these are CDS, you can reference them against a database to obtain functional information. You can download the database here or use the following command:
wget http://huttenhower.sph.harvard.edu/humann2_data/chocophlan/chocophlan.tar.gz
Running HUMAnN2
Once you have your database and your cleaned reads, you can execute the HUMANn2 command as seen below:
humann2 --verbose --threads 4 --input SRS014459-Stool.fasta.gz --output humann2
This will take some time and you will see some output on your terminal.
HUMAnN2 Output Files
When HUMAnN2 is run, three main output files will be created:
1. Gene families file
# Gene Family    SRS014459-Stool_Abundance
UNMAPPED    15961.0000000000
UniRef50_A9FGD2: 50S ribosomal protein L36    111.1111111111
UniRef50_A9FGD2: 50S ribosomal protein L36|g__Bacteroides.s__Bacteroides_cellulosilyticus    111.1111111111
UniRef50_unknown    69.0221119675
UniRef50_unknown|g__Parabacteroides.s__Parabacteroides_distasonis    24.9492552645
UniRef50_unknown|g__Bacteroides.s__Bacteroides_cellulosilyticus    21.9065962172
UniRef50_unknown|g__Bacteroides.s__Bacteroides_stercoris    14.1214184819
UniRef50_unknown|g__Eubacterium.s__Eubacterium_rectale    8.0448420038
UniRef50_B3C5F2    37.0370370370
- File name:
humann2/SRS014459-Stool_genefamilies.tsv - This file details the abundance of each gene family in the community. Gene families are groups of evolutionarily-related protein-coding sequences that often perform similar functions.
- Gene family abundance at the community level is stratified to show the contributions from known and unknown species. Individual species' abundance contributions sum to the community total abundance.
- Gene family abundance is reported in RPK (reads per kilobase) units to normalize for gene length; RPK units reflect relative gene (or transcript) copy number in the community. RPK values can be further sum-normalized to adjust for differences in sequencing depth across samples.
- The "UNMAPPED" value is the total number of reads which remain unmapped after both alignment steps (nucleotide and translated search). Since other gene features in the table are quantified in RPK units, "UNMAPPED" can be interpreted as a single unknown gene of length 1 kilobase recruiting all reads that failed to map to known sequences.
- The UniRef50_unknown values represent the total abundance of reads which map to ChocoPhlAn nucleotide sequences which do not have a UniRef50 annotation.
2. Pathway abundance file
# Pathway    SRS014459-Stool_Abundance
UNMAPPED    4793.8457858841
UNINTEGRATED    1366.7592864498
UNINTEGRATED|g__Bacteroides.s__Bacteroides_stercoris    371.6991372983
UNINTEGRATED|g__Eubacterium.s__Eubacterium_rectale    373.9334209894
UNINTEGRATED|g__Parabacteroides.s__Parabacteroides_distasonis    623.7117375800
PWY-1042: glycolysis IV (plant cytosol)    4.3703939045
PWY-7237: myo-, chiro- and scillo-inositol degradation    3.6465148212
PWY-7237: myo-, chiro- and scillo-inositol degradation|g__Parabacteroides.s__Parabacteroides_distasonis    3.6465148212
HSERMETANA-PWY: L-methionine biosynthesis III    2.5085881952
- File name:
humann2/SRS014459-Stool_pathabundance.tsv - This file details the abundance of each pathway in the community as a function of the abundances of the pathway's component reactions, with each reaction's abundance computed as the sum over abundances of genes catalyzing the reaction.
- Pathway abundance is computed once at the community level and again for each species (plus the "unclassified" stratum) using community- and species-level gene abundances along with the structure of the pathway.
- By default, HUMAnN2 uses MetaCyc pathway definitions and MinPath to identify a parsimonious set of pathways which explain observed reactions in the community.
3. Pathway coverage file
# Pathway    SRS014459-Stool_Coverage
UNMAPPED    1.0000000000
UNINTEGRATED    1.0000000000
UNINTEGRATED|g__Bacteroides.s__Bacteroides_stercoris    1.0000000000
UNINTEGRATED|g__Parabacteroides.s__Parabacteroides_distasonis    1.0000000000
UNINTEGRATED|g__Eubacterium.s__Eubacterium_rectale    1.0000000000
PWY-1042: glycolysis IV (plant cytosol)    0.9209210227
PWY-7237: myo-, chiro- and scillo-inositol degradation    0.8905987444
PWY-7237: myo-, chiro- and scillo-inositol degradation|g__Parabacteroides.s__Parabacteroides_distasonis    0.9417004651
HSERMETANA-PWY: L-methionine biosynthesis III    0.7954342688
- File name:
humann2/SRS014459-Stool_pathcoverage.tsv - Pathway coverage provides an alternative description of the presence (1) and absence (0) of pathways in a community, independent of their quantitative abundance.
- More specifically, HUMAnN2 assigns a confidence score to each reaction detected in the community. Reactions with abundance greater than the median reaction abundance are considered to be more confidently detected than those below the median abundance.
- HUMAnN2 then computes pathway coverage using the same algorithms described above in the context of pathway abundance, but substituting reaction confidence for reaction abundance.
- A pathway with coverage = 1 is considered to be confidently detected (independent of its abundance), as this implies that all of its member reactions were also confidently detected. A pathway with coverage = 0 is considered to less confidently detected (independent of its abundance), as this implies that some of its member reactions were not confidently detected.
- Like pathway abundance, pathway coverage is computed for the community as a whole, as well as for each detected species and the unclassified stratum.
- Much as community-level pathway abundance is not the strict sum of species-level contributions, it is possible for a pathway to be confidently covered at the community level but never confidently detected from any single species.
4. MetaPhlAn2 bugs list
#SampleID    Metaphlan2_Analysis
k__Bacteria    100.0
k__Bacteria|p__Firmicutes    64.91753
k__Bacteria|p__Bacteroidetes    35.08247
k__Bacteria|p__Firmicutes|c__Clostridia    64.91753
k__Bacteria|p__Bacteroidetes|c__Bacteroidia    35.08247
k__Bacteria|p__Firmicutes|c__Clostridia|o__Clostridiales    64.91753
k__Bacteria|p__Bacteroidetes|c__Bacteroidia|o__Bacteroidales    35.08247
k__Bacteria|p__Firmicutes|c__Clostridia|o__Clostridiales|f__Ruminococcaceae    37.7397
k__Bacteria|p__Bacteroidetes|c__Bacteroidia|o__Bacteroidales|f__Bacteroidaceae    31.34317
- File name:
humann2/SRS014459-Stool_temp/SRS014459-Stool_metaphlan_bugs_list.tsv - This file is the bugs list output from MetaPhlAn2.
- Similar to Kraken, MetaPhlAn2 is executed which performs taxonomic classification. However, Kraken is generally faster and better at this, which is why we used that first.
Next Steps
Now that you have your list(s) of organisms and some functional annotation to go with them, many doors have been opened up your analysis. The BioBakery has many options to further your investigation:

Metagenomic Assembly
One of the more challenging tasks is to assembly metagenomes, though it proves extremely useful, especially when tracking down a novel organism. However, there are many tools available to help with this task, such as MetAMOS, IDBA, and the Khmer package. Once you have a complete-ish genome you are then able to use conventional sequence analysis methods.